WNBA play-by-play stats are offered in CSV format that has all events occur in a game. Additionally, it includes active lineups, shot distances and shot locations in X, Y coordinates. You get individual game logs and a combined file for the season which includes all games from regular season and playoffs.
Each season dataset comes up with 2 types of files: 1) Individual CSV files for all games played in the regular season and the playoffs. 2) A season-to-date CSV file where all CSV game files are combined. Having this file, you can analyze the whole season stats in one sheet. In brief, our database-friendly (each play presented in a row) log includes every in-game movement such as: “Active players on the court”, “event time (remaining/elapsing)”, “play length & id”, “activity type (substitution/shot/free throw/turnover/foul committed & drawn/rebound/assist/jump ball etc.)”, “shot location” and “shot coordinates”.
Open the sample dataset where descriptions for all columns have been already provided. Keep in mind that, those descriptions do not appear on the season game logs, so we recommend you to keep the sample file easily accessible until you get along with our play-by-play logs.
To give you an idea: Inside the combined CSV file of 2018 season, there are 220 individual games and 85,732 rows; which makes ~390 rows per game. The size of the 2018 complete dataset is 57.3 MB and becomes 5.3 MB when zipped.
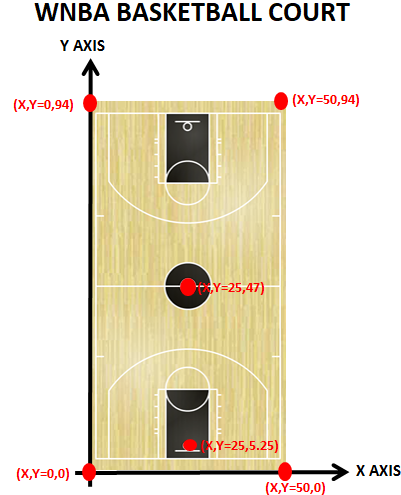
A standard WNBA basketball court is 50 feet wide, 94 feet long.
We provide shot locations in two ways:
1) X-Axis, Y-Axis values.
2) X-Axis and Y-Axis values are converted to X, Y coordinates in terms of feet which reflect a standard WNBA basketball court dimension.
Each game log has been named with details such as; “game date”, “game id”, “road team initials” and “home team initials” Example: [2016-05-14]-1021600003-PHO@MIN